That’s a long title for my latest coding experiment, a neat analog clock composed of a complex of animated branches and leafs. I named the project after Groot, the plant-like superhero most recently appearing in the Guardian of the Galaxy movies. The idea for the clock originated while experimenting with an approach for simulating hand-drawn circles and lines using the three.js 3D library.
My plan is to describe the cool parts of this project over several articles beginning with how I simulate hand drawn lines and circles. A link to the code described here can be found at the end of this article. Lastly, this article assumes you have some basic familiarity with three.js.
Simulate hand-drawn lines and circles
My approach to simulating hand-drawn lines begins with dividing a line into segment. Then segment vertices are offset, i.e., perturbed, by a small random amount. A line is then drawn through the perturbed vertices producing a wavey hand-drawn line effect.

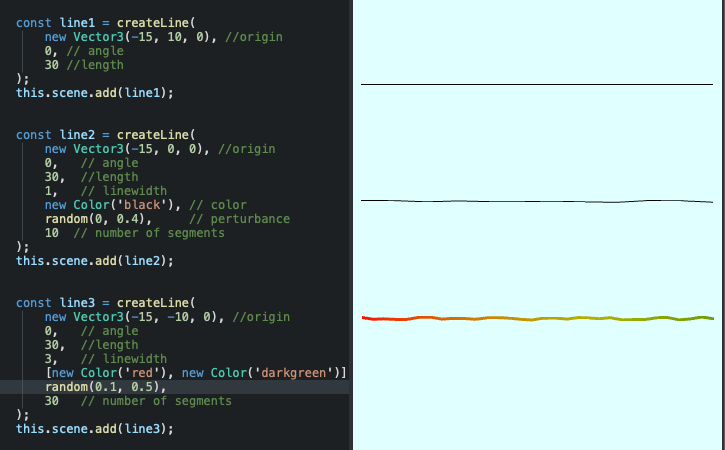
The lines in this example were created by the createLine() function I using different segment counts and perturbance. Calling the createLine() function with fewer segment count results in smoother curves. Increasing the perturbance increases the jaggedness of the line, especially if the segment lengths are short.
The TypeScript createLine() function is shown below. Note the required arguments are the origin, the angle of the line and line length. Choosing to provide the minimum number of arguments results in a straight line similar to top line shown above.
 /**
  * Creates a wavy colored three.js line.
  *
  * @remarks
  * This method creates a three.js Line with special effects.
  * The perturbance and segmentCount determine the
  * wavyiness of the resulting line.
  *
  * How it works: the segmentCount specifies how many
  * equal length segments to divide the line length into.
  * Then each segment vertex is offset by a random value between
  * 0 and the peturbance parameter. Then a cubic spline is fit
  * through the segment vertices. If the color parameter is a
  * [Color,Color] then a gradient of colors starting with the 1st
  * element and ending with the 2nd element is evenly distributed
  * across each internal line segment. The resulting three.js Line
  * is created using a geometry based on the line segments vertices
  * and a line-material.
  *
  * @param origin - starting point of Line
  * @param angle - angle (radians) of the line extending from the
  *                origin
  * @param length - length of the line to create, must be > 0.0
  * @param width? - width of the new line, default = 1
  * @param color? - line color, a three.js Color or [Color,Color]
  *                 specifying start and end gradient colors.
  *                 default = random Color
  * @param perturbance? - maximum displacement of a segment vertex
  *                       from the centerline of the line,
  *                       default = 0.0
  * @param segmentCount? - number of internal segments to divide
  *                        the line, default = 1;
  * @param material? - line-material to use for the Line,
  *                    default = new LineBasicMaterial
  * @returns A new three.js Line
  *
  * @example
  * createLine(
  *     new Vector(),
  *     Math.PI/4.0,
  *     10.5)
  *
  * createLine(
  *     new Vector10,30,-5(),
  *     Math.PI/4.0,
  *     50,
  *     3,
  *     [new Color(1,0,0),new Color(0,1,0]),
  *     0.5,
  *     25,
  *     new LineDashedMaterial({
  *          dashSize: 2,
  *          gapSize: 2}) )
  */
function createLine(origin: Vector3, angle: number, length: number,
      width = 1, color: Color | [Color, Color] = randomColor(),
      perturbance = 0.0, segmentCount = 1,
      material?: LineBasicMaterial | LineDashedMaterial): Line {

  // generate points
  const segmentLength = length / segmentCount;
  const segmentPoints = new Array();
  const deltaX = segmentLength * Math.cos(angle);
  const deltaY = segmentLength * Math.sin(angle);

  for (let i = 0; i < segmentCount + 1; i++) {
    segmentPoints.push(
      new Vector2(
        origin.x + i * deltaX + random(-perturbance, perturbance),
        origin.y + i * deltaY + random(-perturbance, perturbance)));
    }

  const spline = new SplineCurve(segmentPoints);
  const splinePoints = spline.getPoints(segmentPoints.length);
  const geometry = new BufferGeometry().setFromPoints(splinePoints);

  if (Array.isArray(color)) {
    const vertCnt = geometry.getAttribute('position').count;
    const colors =
       createColorGradientBufferAttribute(color[0], color[1],
          vertCnt);
    geometry.addAttribute('color', colors);
  }

  const mat = material ? material :
        new LineBasicMaterial({
             vertexColors: VertexColors,
             linewidth: width });

  if (!Array.isArray(color)) {
      mat.color = color;
  } else {
      mat.vertexColors = VertexColors;
  }

  // create line and return it
  const line = new Line(geometry, mat);
  line.position.z = origin.z;
  line.computeLineDistances();

  return line;
}
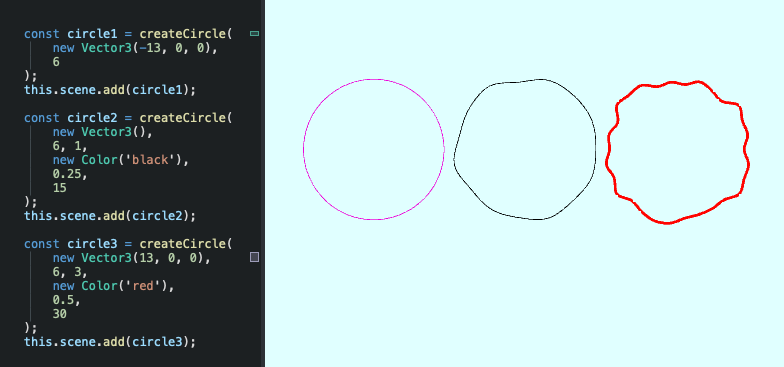
To simulate hand-drawn circles, I implemented the createCircle() function similar to the createLine() function.

Experiment with the createLine() and createCircle() functions and see what interesting results you achieve. You can find all of the code for the Groot Clock project here.
In Part-2, I’ll discuss gradient coloring of lines and circles in three.js. In the meantime please consider following me on twitter. All comments, suggestions and retweets will be greatly appreciated.
